Financial statements are the window to a business entity’s financial performance and health. Various stakeholders such as shareholders, investors, creditors, banks etc. assess and analyze the financial statements. This analysis helps them gauge various aspects of the entity’s financial health which then forms the basis for their decision making. Merely analyzing financial statements in isolation may not be sufficient for this purpose. They may need to be compared with financial statements of previous years or with those of other comparable entities to be more meaningful.
The article horizontal vs vertical analysis looks at meaning of and differences between two ways of analyzing financial statements – horizontal analysis and vertical analysis.
Definitions and meanings
Horizontal analysis:
In this form of financial statement analysis, financial data of one accounting period is compared with financial historical data of one or more previous accounting periods. Horizontal analysis consists of one base year and one or more comparison years. This is also termed as trend analysis. Horizontal analysis is of two types:
Absolute analysis:
In an absolute analysis, financial data in the form of absolute values are compared year on year.
Absolute analysis (USD) = Amount in comparison year – Amount in base year
Percentage analysis:
In percentage analysis, financial data in percentage form is disclosed and compared. Percentages are worked on the basis of a selected base year and then compared.
Percentage analysis = [(Amount in comparison year – Amount in base year)/Amount in base year] × 100
Insight into these can be gauged through a numerical example.
Example:
A comparative balance sheet of ABC Inc. demonstrating horizontal analysis is detailed below:
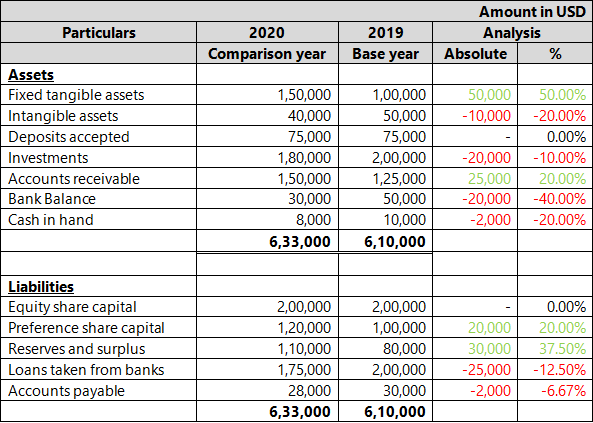
An analysis based on this comparative statement can reveal likely growth in the company due to increasing fixed assets and reserves and surplus. On the other hand, reduced investments and bank balance may indicate a deterioration in the cash flow/liquidity position.
Similar comparative statements are typically drawn out for income statement and cash flow statement as well to give a complete picture.
Horizontal analysis can thus give an insight into how a company is growing. It helps identifying growth trends as well as can indicate how efficiently the business is managing its expenses over the years. This type of analysis, however, suffers from one major drawback. It can be manipulated by keeping a very weak performance year as the base year, making performance of other comparison years look more attractive than they actually are.
Vertical analysis:
In this form of financial statement analysis, financial data of a single accounting period is compared with other financial data of the same entity of the same accounting period. For vertical analysis, a base line item in the financial statements is chosen and all other line items are expressed in percentage terms relative to the selected base item.
Example
The base item is the total assets in case of asset line items and total liabilities in case of liability line items
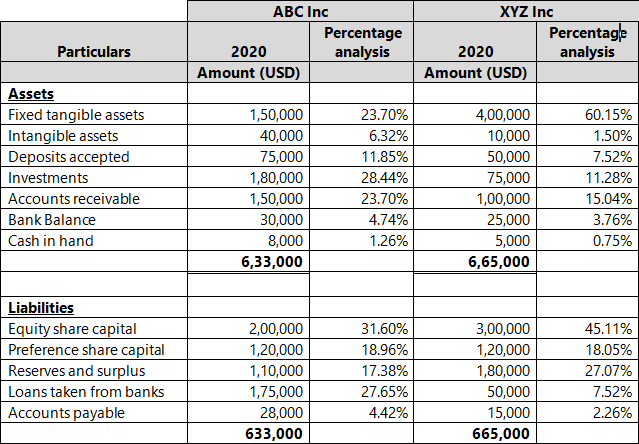
A comparison of the two companies’ financial statements based on vertical analysis, reveals that XYZ Inc. is extremely capital heavy as the proportion of its fixed assets is very high when compared to ABC Inc. On the other hand, ABC Inc has high dependency on loans for funds raising as compared to XYZ Inc who has a lower percentage of loans vis-à-vis equity.
Difference between horizontal and vertical analysis
The five key points of difference between horizontal and vertical analysis of financial statements are detailed below:
1. Meaning
- Horizontal analysis is a financial statement analysis tool that compares financial data movement across accounting periods.
- Vertical analysis is a financial statement analysis tool that presents each line item in the financial statement as a percentage of a decided base item in the financial statement.
2. Basis for comparison
- Horizontal analysis uses historical financial data as the basis for comparison. Hence, there must always be a base year and one or more comparison years.
- Vertical analysis uses current year financial data for comparison. There must be a single base line item and multiple comparison line items.
3. Presented as
- Horizontal analysis can be presented as absolute values or on a percentage basis.
- Vertical analysis is presented only on percentage basis.
4. Application
- Horizontal analysis primarily helps in identifying growth trends and patterns. This analysis can be applied for projecting future performance numbers based on the trends identified through horizontal analysis.
- Vertical analysis has several internal as well as external applications:
Internal: It helps management set baseline performance ratios, and assessing the actual ratios can help them take decisions. For example, If profit ratio from a specific product line is consistently falling below the set threshold, management may take a decision to discontinue it.
External: It helps in comparison of financial data amongst companies within the same sector. This can help stakeholders determine where the performance of a particular company stands in relation to its peers.
5. Drawbacks
- Horizontal analysis can be manipulated by analysts. By setting a poor performance year as the base year, the comparative performance of other years can be artificially heightened which can mislead stakeholders.
- Vertical analysis suffers from different drawbacks. There is no published standard for calculated ratios. Thus, analysis of financial statements of a single company through vertical analysis can have limited utility. Further the utility of vertical analysis reduces if the manner of computation of the base item differs amongst companies being compared. Vertical analysis also does not reveal comparative sizes of companies as only percentages are analyzed and not absolute values.
Conclusion – horizontal vs vertical analysis
Both horizontal and vertical analysis hold their own place in financial statements analysis. While each has its distinct advantages and disadvantages, they are often used together to give a more comprehensive comparative picture to stakeholders. They, together, are key to understanding the financial position of a business entity.